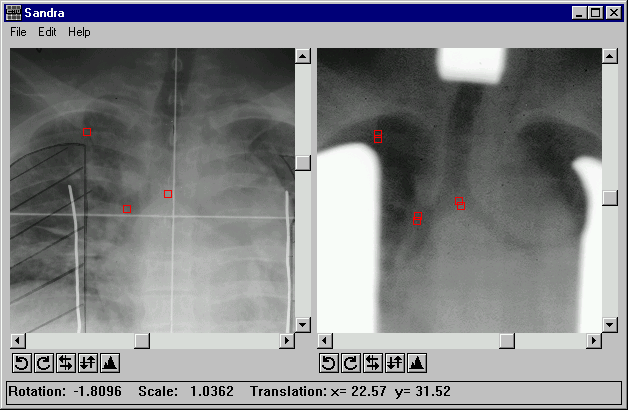
Figure 4: Screen shot of program after registering two images.
The chosen language for the implementation of the algorithms previously discussed was Interactive Data Language or IDL (Research Systems Incorporated). IDL is an interpreted array-oriented language combined with many graphical display and mathematical analysis routines. It also incorporates routines to allow the writing of programs with graphical user interfaces. Programs written in IDL can be run on all supported platforms (Unix, VMS, Microsoft Windows, Macintosh) with only small modifications.
The user interface for the program was implemented using the IDL widgets. Widgets are simple reusable graphical objects, such as buttons, menus, scrollbars or display areas, that allow user interaction via a pointing device and a keyboard. A special class of widgets, mangers, exists that control the layout of other widgets.
The user interface consists of two scrolled draw widgets placed horizontally next to each other in which the two images to be compared are loaded. Below each scrolled draw widget is a row of buttons to enable the image to be histogram equalized, flipped and rotated in 90 degree increments. A menu bar for the common operations such as loading images, clearing control points, and performing transformations runs along the top of the window. Along the base of the window is a status bar for passing messages to the user. Control points are selected by clicking at the appropriate places in the two scrolled draw widgets (see figure 5).

The images were obtained by taking both standard portal and simulator radiographs and digitizing them, using a scanner. The scanner used, was a LumiscanTM 100. This laser scanning device digitizes a radiograph by scanning a focused spot of light across the film, as it is moved perpendicular to the scan. The transmitted light is then converted to an electrical signal using a photo-multiplier tube and digitized. The LumiscanTM 100 can digitize a radiograph up to 14"×17" using 12 bits for the intensity, and up to a resolution of 256 pixels per inch.
The image format that the LumiscanTM device saves digitized images in is proprietary, so before the scanned images could be used a custom routine to phrase the image file and load in the data had to be written. The scanner digitizes the image using 12 bits for the intensity, so when this is stored in the image file the intensity level for each pixel is stored in two bytes. This means that any routine to read in the image has to be aware of the endianes (byte order) of the machine on which it is running, or the loaded image will be gibberish. The endianes of the machine on which the program is running is tested, and if it differs from the endianes in which the image is stored (always little endian) a byte swap is done on the image data. For Intel x86 machines this is not a problem as they are little endian, but many Unix machines and Macintoshes are big endian. The code for this routine can be seen in Appendix B.
The images are copied from their byte arrays into the draw widgets using IDL's TVSCL routine. This procedure takes a two dimensional array of numbers and outputs the data to the display, scaling the data to use the maximum number of available colours. A blue/white colour lookup table was used to enhance the contrast.
The image display facilities of IDL are much simpler than using the underlying windowing system. However, a limitation of IDL is that it only uses a maximum of 256 colours. An additional drawback is that each time the image is displayed it has to be converted into the window systems device independent bitmap format. A program written for the native window system would manipulate this bitmap directly, therefore reducing memory overheads and speeding up image display.
The built in histogram equalization routine in IDL (HIST_EQUAL) is severely limited. Only basic global equalization with cut-offs is provided, and even this has the unfortunate side effect of converting all output images to 8 bits. Additionally the minimum and maximum cut-off values only work on byte input data. The interpretive nature of the IDL language means that improved adaptive histogram equalization techniques that have shown promise in the area of portal images (Rosenman et al. 1993) would be prohibitively slow.

The histogram equalization as implemented brings up a modal dialog box that displays a histogram of the image. The user is then free to interactively select minimum and maximum cutoff values using two sliders to optimize the histogram equalization to produce the maximum contrast improvement (see figure 5).
Pairs of fiducial points are selected by clicking on both images to identify the coordinates in each image of a structure present in it. This causes a small square, the centre of which is the position of the point selected, to be drawn on the image. The points have to be selected in their corresponding pairs, i.e. after the selection of a point in the left image the corresponding point must be chosen in the right image before another point can be selected in the left image. The status bar is used to display the coordinates of the selected fiducial point and how many pairs of points have been selected. The status bar is also used to pass suitable error messages to the user if they click out of sequence on an image.
Although the automatic selection of fiducial points using image processing techniques is theoretically possible, no guarantee would exist that the selected points would correspond to invariant features in the images. The selection of suitable fiducial points represents the slowest part of the procedure for image alignment.
A facility is provided for the user to clear the selected fiducial points if an error has been made. Also, rotating, flipping and loading a new image causes all the selected fiducial points to be automatically cleared.
The built in routine POLY_2D was used to transform the image. This is a general purpose routine that geometrically transforms any two dimensional array of numbers using an arbitrary polynomial. The resulting array is defined by
| v(x,y) = u(x´,y´) = u(a(x,y),b(x,y)) |
where v(x,y) represents the pixel in the output image at coordinate (x,y), and u(x´,y´) is the pixel at (x´,y´) in the input image used to derive v(x,y). The functions a(x,y) and b(x,y) are polynomials in x and y of degree n, whose coefficients are given by U and V and specify the spatial transformation
| x´ = a(x,y) = |
n å i = 0 |
n å j = 0 |
Ui,jxj yi |
| y´ = b(x,y) = |
n å i = 0 |
n å j = 0 |
Vi,jxj yi |
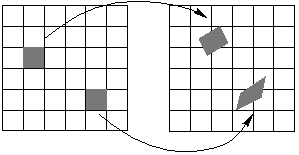
The POLY_2D routine uses inverse mapping, this means that the brightness of pixels in the transformed image is calculated by looking at which point in the input image, the output pixel corresponds to. Various sampling and interpolation techniques can be used to calculate the brightness value as it is unlikely that the input pixels will exactly correspond to an output pixel (see figure 6).

The transformation passed to the POLY_2D routine is that required to map the transformed image onto the input image. This is counter intuitive, but is accomplished by simply swapping the points around in the system of linear equations (4). The singular value decomposition is calculated using IDL's SVDC routine. This is an implementation of the routine found in Press et al. (1992). The individual components that make up the transformation are displayed on the status bar.
The POLY_2D routine can use either nearest neighbour, bilinear or cubic interpolation. Cubic interpolation was used as it produces the best results, although it is much slower than bilinear or nearest neighbour interpolation.
To provide some feedback to the operator on the accuracy of the selected fiducial points, the points for the transformed image were transformed as well, and plotted alongside those from the reference image. Using this method the better the pairs of points match up in the two images, the closer the two points when plotted. Poorly selected, points are immediately apparent, as they will show significant separation from one another.
To allow the two images to be compared after alignment, a fader dialog is provided. This superimposes the two images upon each other. The fraction of each image displayed is controlled by means of a slider. This allows the user to fade from one image to the other, by which means deciding whether any mismatch between the simulator and portal images is possible.
Several drawbacks to IDL were encountered while conducting this project. The range of widget types provided is limited, in particular the geometry management provided does not extend to resize events. The behaviour of the widgets was found to vary significantly under different platforms, particular problems existing in the creation of scrolled drawing area widgets.
Medical images are often 10 and 12 bit, especially in the field of digital radiography. The current version of IDL (4.0.1) provides little support for images with more than 8 bits, routines often scaling the output of 10 and 12 bit images to 8 bits. The image display routines use a maximum of 256 colours despite 16/24 bit graphic cards being the norm. I would contend that those problems make IDL less than ideal for the processing of many medical images.
The interpreted virtual machine architecture of IDL slows down any processing of large datasets outside the built in routines. Although provision is made for writing external routines in languages such as C or Fortran, it is not supported on all platforms and adds an extra layer of complexity. The provision of a just in time compiler for the virtual machine would lessen this problem. The just in time compiler converts the byte code of the virtual machine into machine code immediately before execution. This technique can provide performance similar to compiled C code and would eliminate the speed problems.
For rough and ready implementations of algorithms to test their effectiveness, IDL is powerful and useful tool. However factors such as cost, speed, flexibility, and robustness means that for writing programs that would be used on a day to day basis in a clinical environment, traditional languages like `C' remain the first choice over tools such as IDL.